Previous work on WISP often involved the creation of new tools to process data from WISP tags and visualize it in meaningful ways. Unfortunately, because these apps were mostly developed to test the functionality of a feature, they were not extensible or particularly user friendly.
Along with the redesigned hardware of WISP 6.0, we wanted to release a companion desktop application that could efficiently process and visualize WISP data while also being modular, making it easy to create new visualizations or build support for new WISP sensors.
Architecture
WISP devices encode their data into an EPC, which is a 96 byte value that can be read by an off the shelf LLRP RFID reader. Our app needs to be able to process incoming tag EPCs fast. At it’s maximum, a camera tag can produce about 330 unique EPCs per second. This high volume of data mandates a separation between the RFID interface, tag processing and the GUI. Our solution involves running these three processes synchronously.
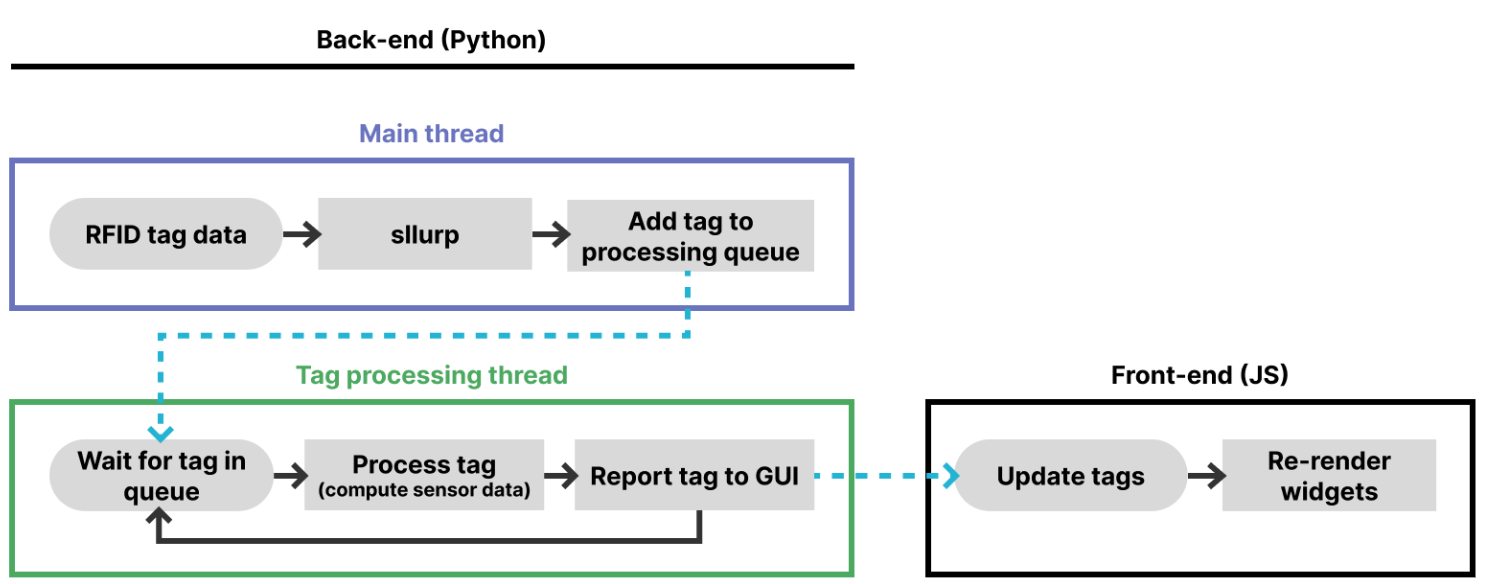
Tag processing
EPC values from WISP tags need to be parsed differently based on the sensor type. And some tags are especially complicated to parse, like camera and audio WISP devices, as they spread a single sensor readings across many thousands of EPCs. When the backend reciieves an EPC, it finds the associated parser (based on the WISP sensor type). The parser then performs any necessary processing on the EPC and returns a JSON object with the parsed data. This gets passed through to the front-end where widgets can visualize the data in real time.
GUI
The app’s front-end uses an existing copy of a Chromium browser or Firefox to display the React app. It receives events from the back-end each time a new tag is read and updates all the dependent visualizations. By exporting this data to a JSON file, the app’s session can be restored later.
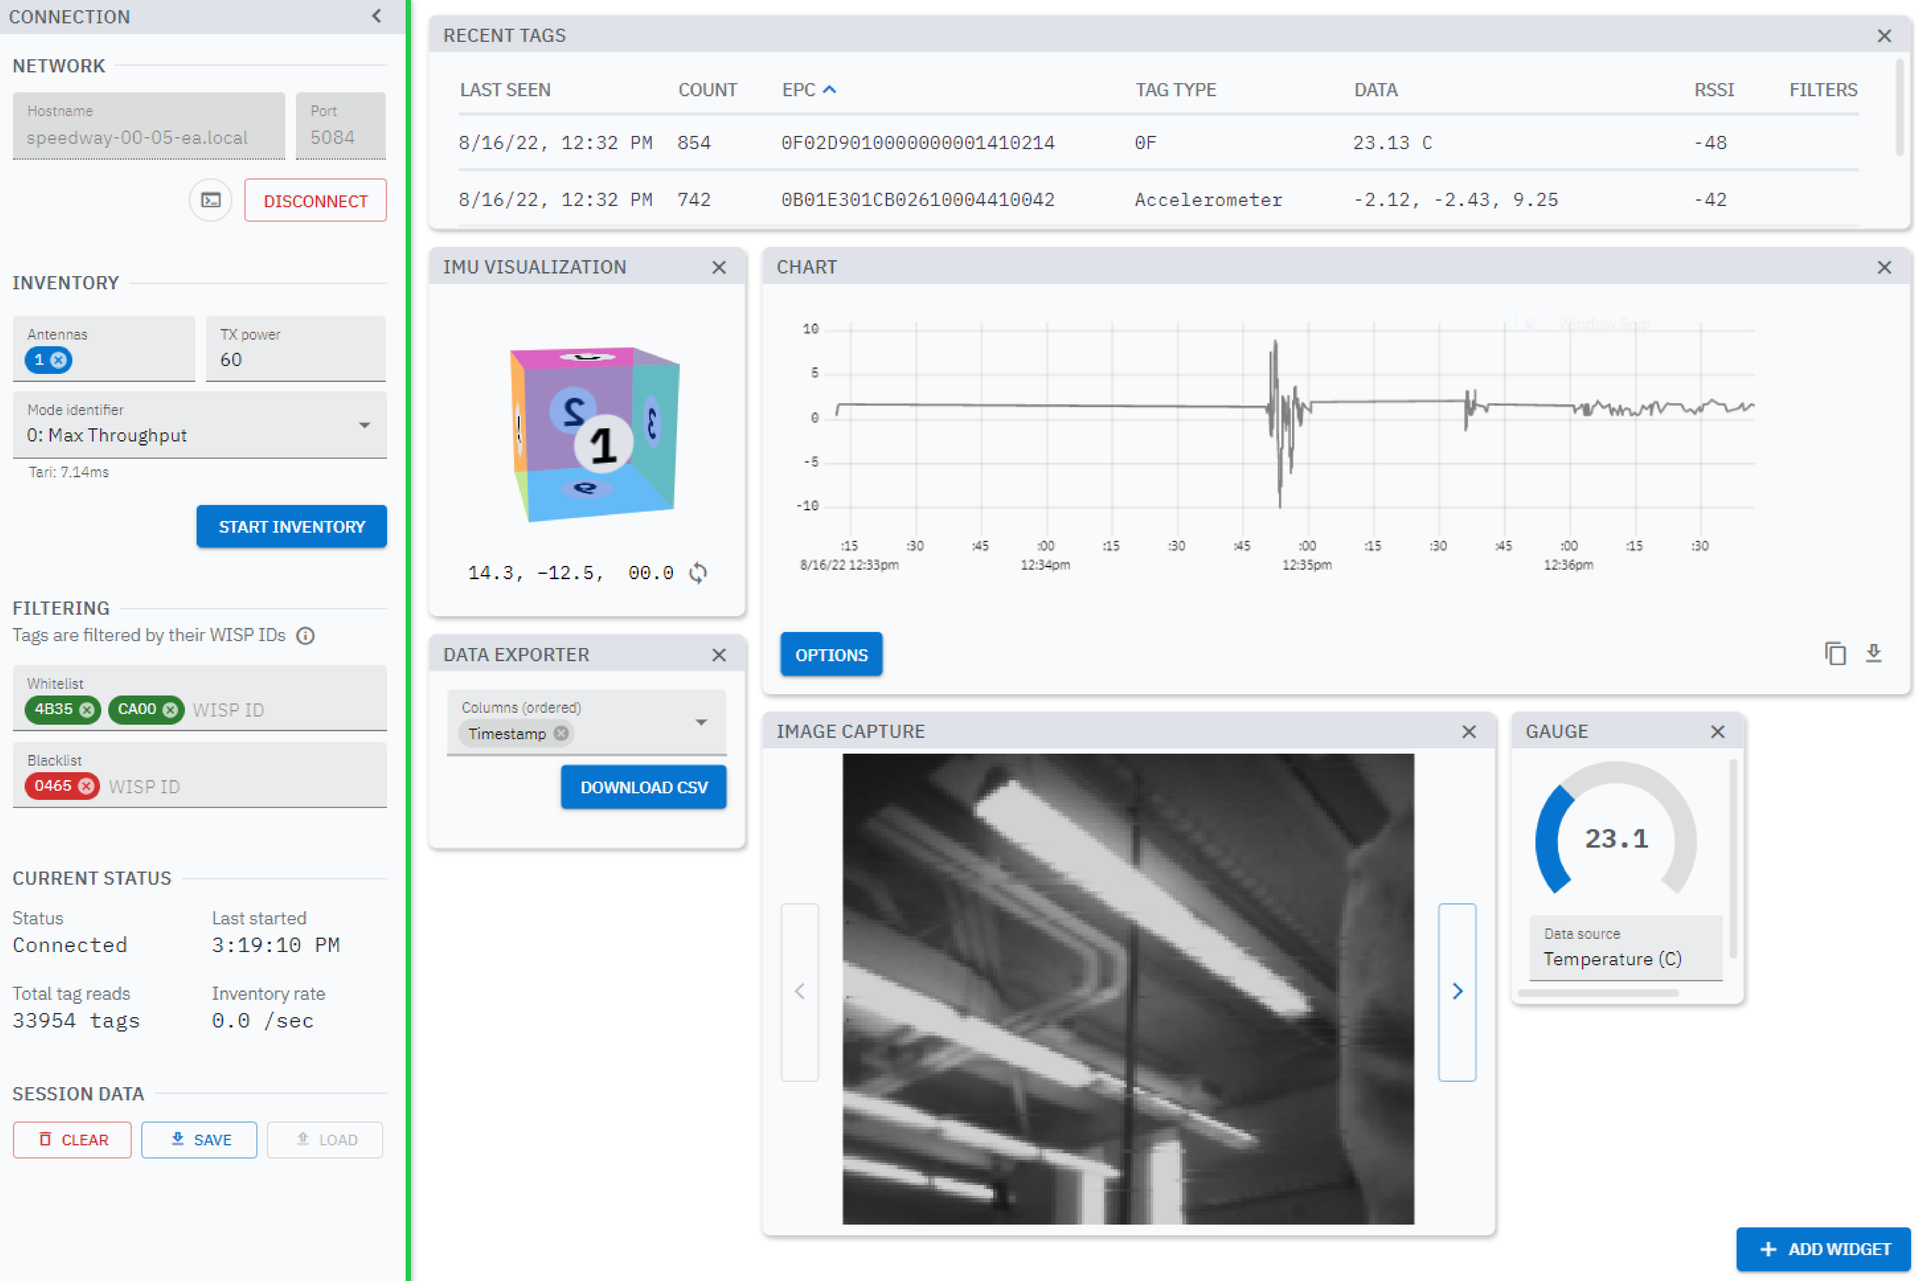
The app is centered around widgets which can visualize data from a tag or set of tags. These can be arranged and resized to create a dashboard for a specific use case. Some widgets act as general purpose tools (like the graphing and data export widgets), while others are sensor-specific (like the image viewer and accelerometer widgets).
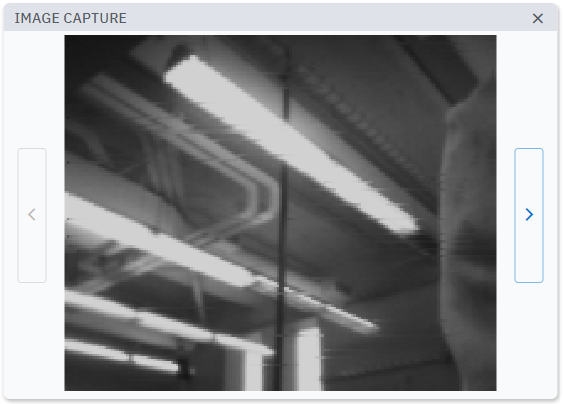
As tags arrive from a camera WISP, the image loads in progressively
Widgets are just React components, so it’s easy to create new ones, and there are virtually no limits on the kind of processing or visualization that can be done (as long as render time is properly managed with throttling). The accelerometer widget is a good example of how widgets can take advantage of web technologies to do much of the heavy lifting.
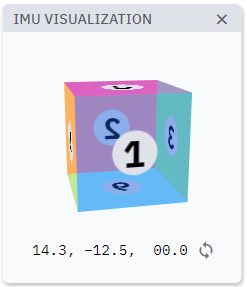
The cube is rendered with just CSS 3D transforms so we didn’t need to include an entire rendering engine for a simple visual