Initial sensor versions · 2020/4/11
Version 1
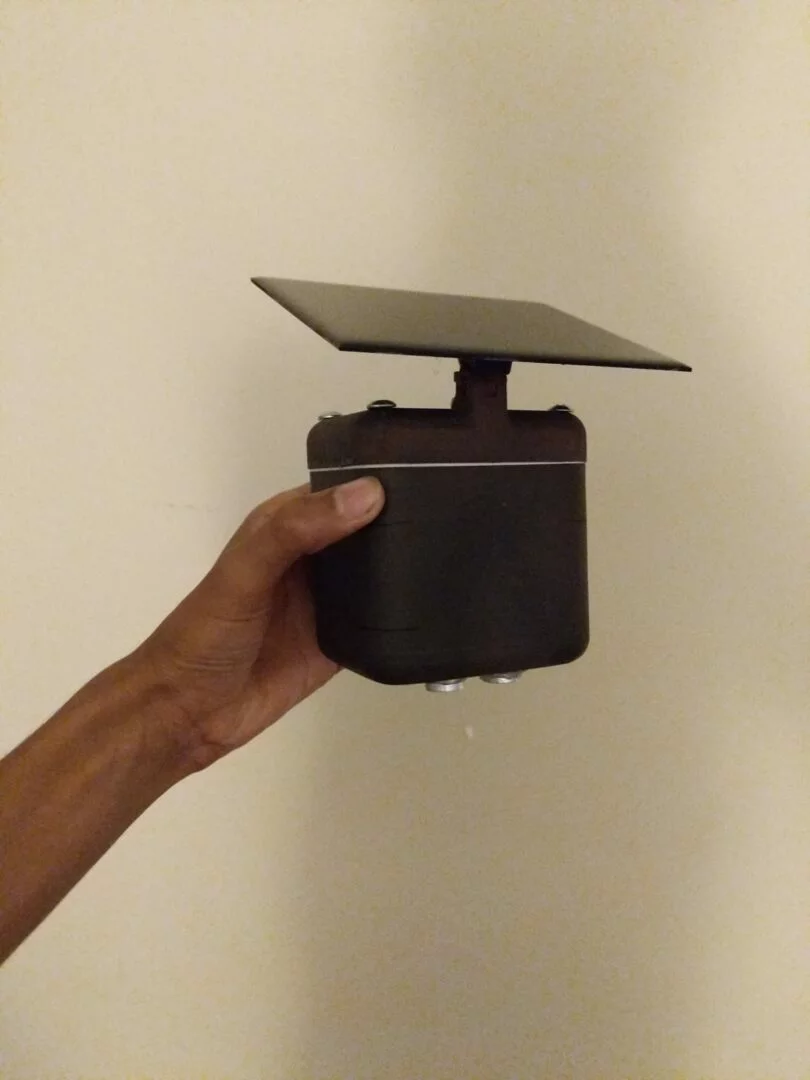
For the first version of our sensor, we focused on developing a device that could take accurate measurements of the water’s stage height. We initially chose an ultrasonic range finder for this purpose. It was oriented towards the water’s surface. By subtracting the measured value from the height at which the sensor was mounted, we could calculate the height of water flowing through the stream.
We decided to power this device with a solar panel and lithium polymer battery. This would theoretically allow the device to be deployed indefinitely. For communication, a WiFi-based Particle Photon microcontroller was used. WiFi limits the possible locations of the device’s deployment, but we were less focused with this issue with this iteration. We were more focused on developing a device that could stay powered while providing accurate measurements.
While this iteration showed promise, it had issues revolving around waterproofing, battery life and connectivity.
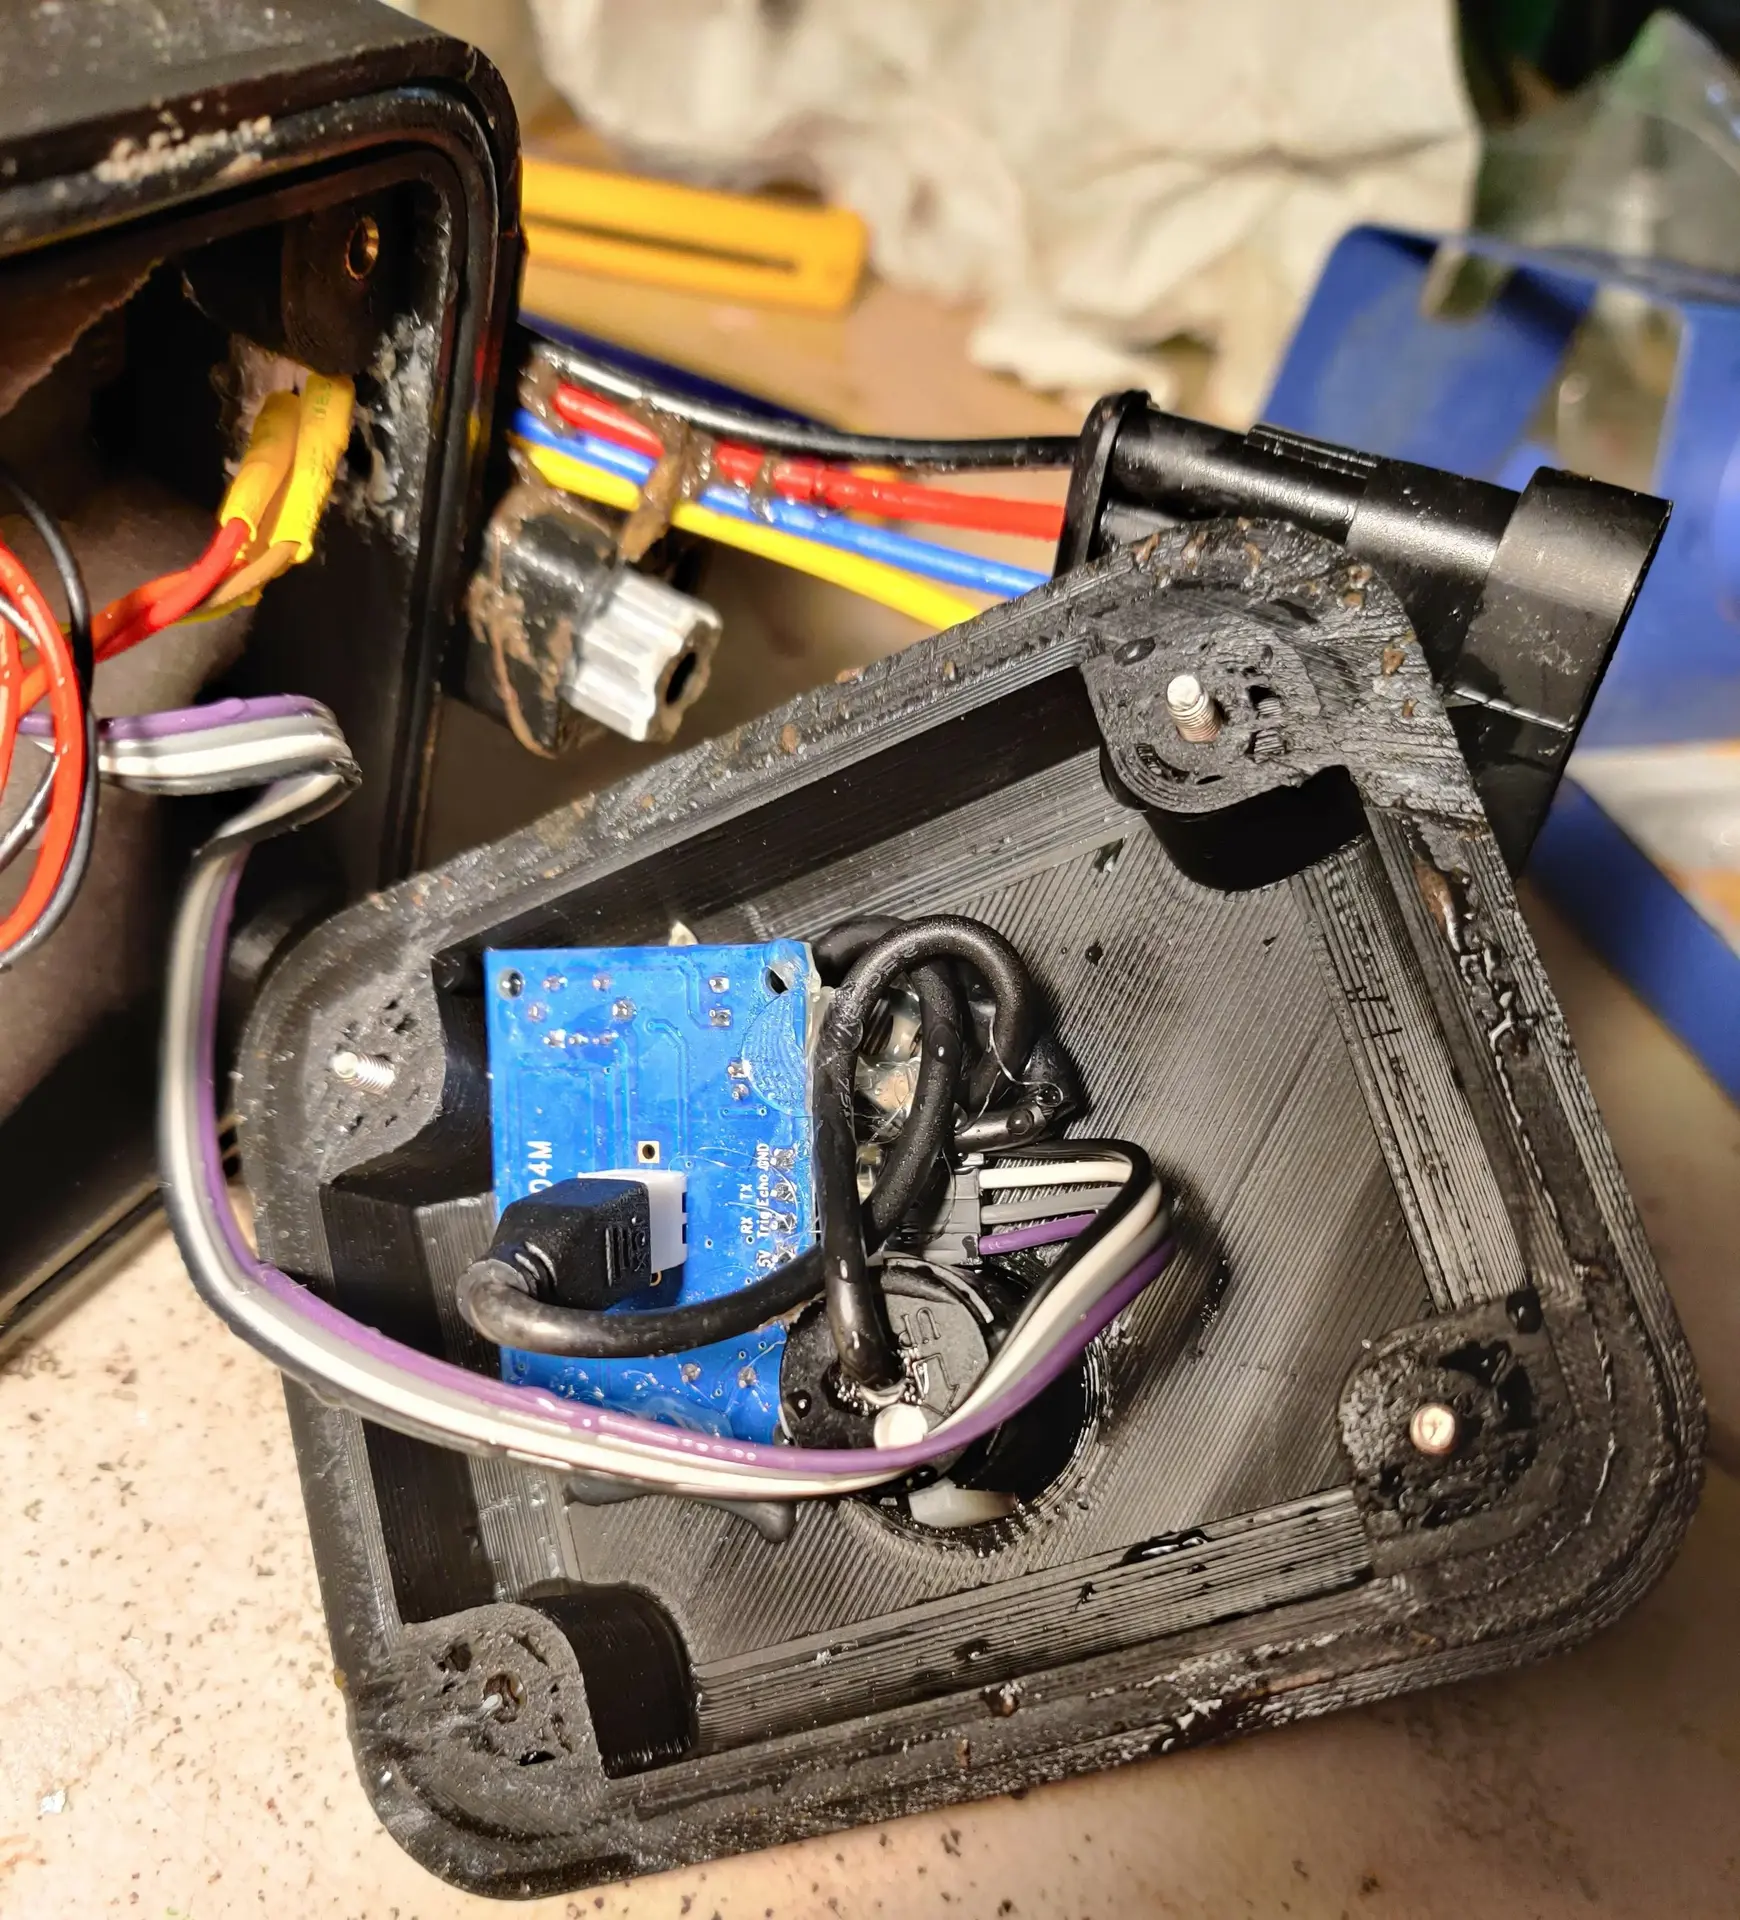
While ultrasonic seemed like the clear choice for the sensor, it made the device almost impossible to waterproof. Unfortunately, the ultrasonic sounds from the HC-SR04 can not permeate almost any waterproof materials. This means that the receiving and transmitting elements were directly exposed to weather. They developed rust and failed within a week.
Both the battery and microcontroller operated on 3.3 volts. The ultrasonic sensor required 5 volts to function properly, so a voltage boost circuit had to be added. This added complexity and reduced battery life.
The WiFi based microcontroller that was used prevented the device from being deployed anywhere without an access point and permission to use it. This was the main barrier that we sought to overcome in our next iteration.
Version 2
The second design iteration was driven by some of the issues we discovered in preliminary testing of the first version.
This version began with a choice in communication method. LoRa (Long Range) is a communication protocol for low bandwidth and low power communication. There is a large community of developers using LoRa for sensors similar to ours. Some were achieving distances of upwards of 20 miles from transmitter to base station. We determined that most streams of interest would be within 20 miles of a WiFi and power source where a base station could be installed.
After beginning to test the possible range of the sensor, we quickly started realizing that it was going to pose an issue. Simply getting one mile to the nearest stream was impossible. We knew that tree cover was going to reduce the signal strength, but we were not expecting the loss of signal that we observed. Our signal strength was also significantly decreased by the fact that rivers tend to be located in valleys, which meant that our sensor would not have a direct line of sight to the base station. To attempt to fix these issues we first switched from standard linear antennas to two directional antennas.
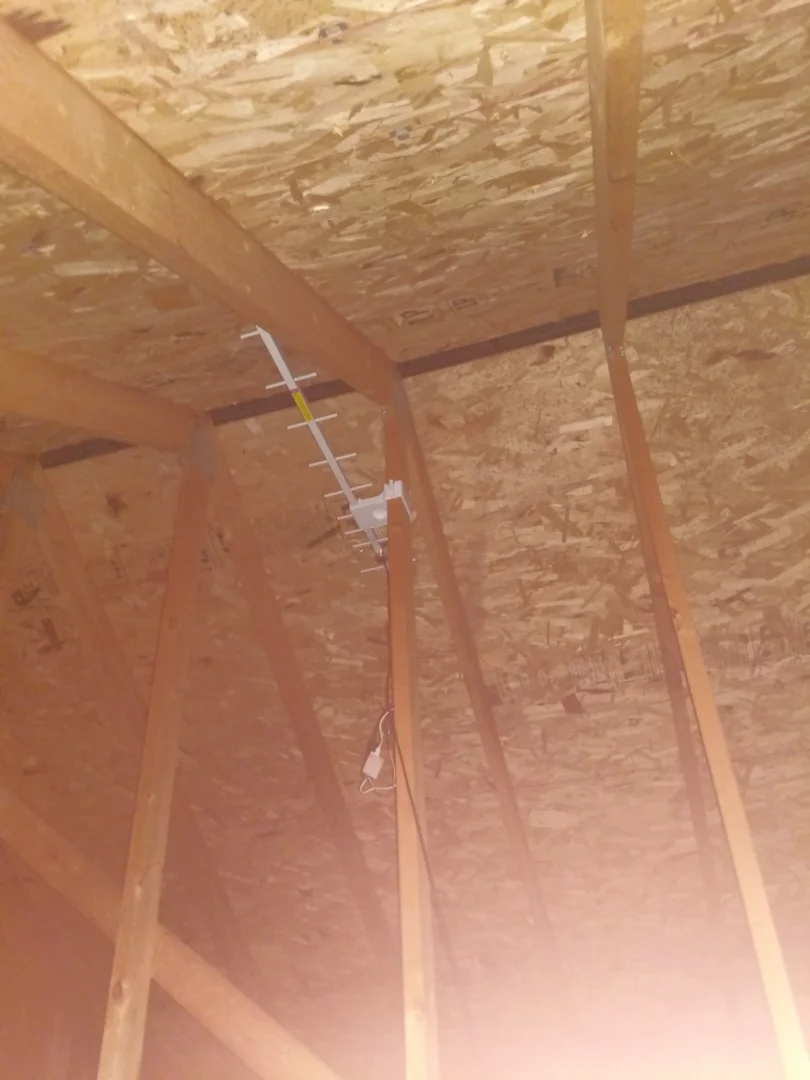
A directional Yagi antenna mounted in the highest place we could get it: the attic.
This improvement in range allowed us to develop a sensor for a neighborhood stream about .2 miles from the base station.
Although the use of directional antennas did result in an increase in usable range, this increase was not significant enough to make this a practical solution. We briefly considered creating a system of several repeater stations to re-broadcast signals until the data arrived at our base station, but we decided that a simpler solution would be to move to a communication protocol for which a significant infrastructure of “repeater nodes” already exists – cellular.
Version 3
For the third version of the sensor, we again desired to improve on some of the issues that we discovered with our second design iteration.
Firstly, we switched from LoRa to cellular as the method we would use to transmit data from the sensor. Cellular was initially dismissed as a possible communication method due to its relatively high power consumption. We knew that there would be new challenges to using cellular connectivity, but its benefits would outweigh the costs. By using cellular, we were longer limited by our distance to the sensor – as long as we were within the range of a cell tower, we would (theoretically) be able to transmit stream data.
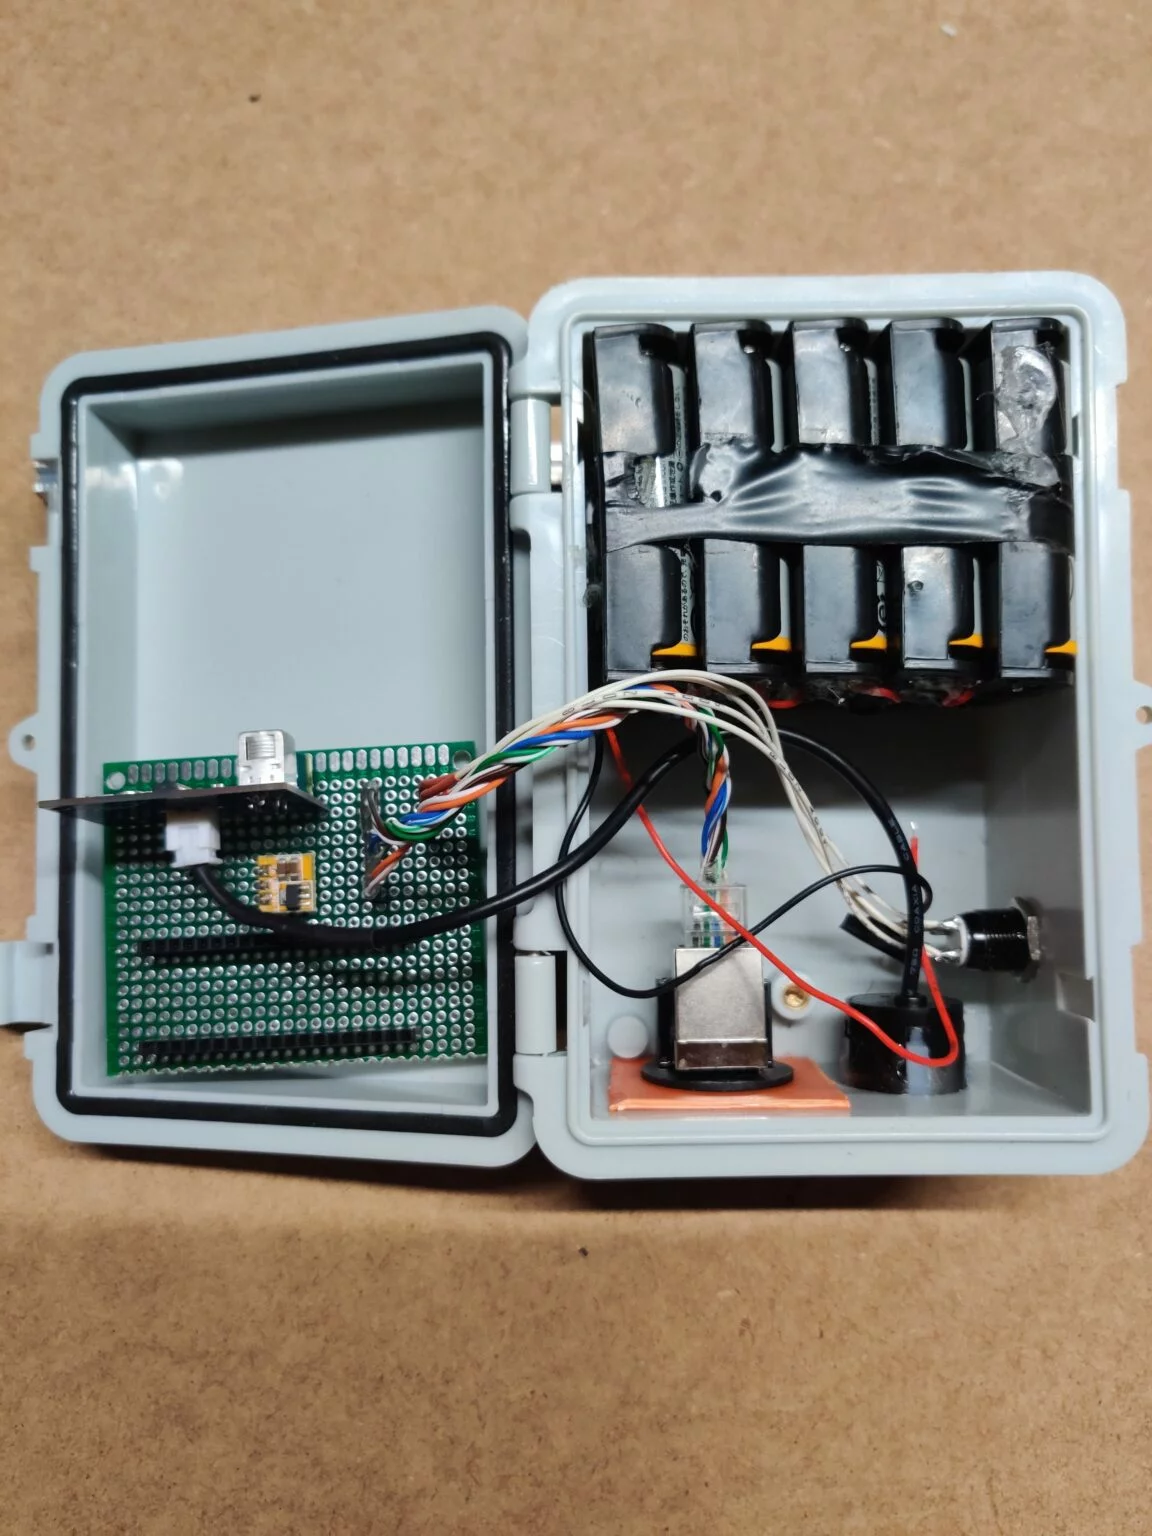
Another change that was made in the third design iteration was to switch to AA batteries instead of LiPo (Lithium Polymer) battery cells for our power source. Although alkaline batteries are less energy dense than lithium based batteries, switching came with a variety of advantages. AA batteries are less dangerous, as they don’t have a tendency to ignite when over-discharged. They also have a much longer shelf life, and are less susceptible to extreme temperature and water damage. We found that they performed at temperatures near freezing, which was an important consideration for us.
To reduce power consumption in this version, we added a secondary microcontroller to control power to the main cellular microcontroller. While on the surface, this may seem like simply doubling the required power, it proved highly effective to extend the battery life of the device. The power switching microcontroller is outfitted with a real time clock (RTC). It allows it to enter a very deep sleep state in between sensor readings. Each hour, the RTC wakes up the power switching microcontroller which subsequently uses a MOSFET to provide power to the cellular Particle Boron. This reduced the on-time of the device from 60/60 minutes to about 7/60 minutes.
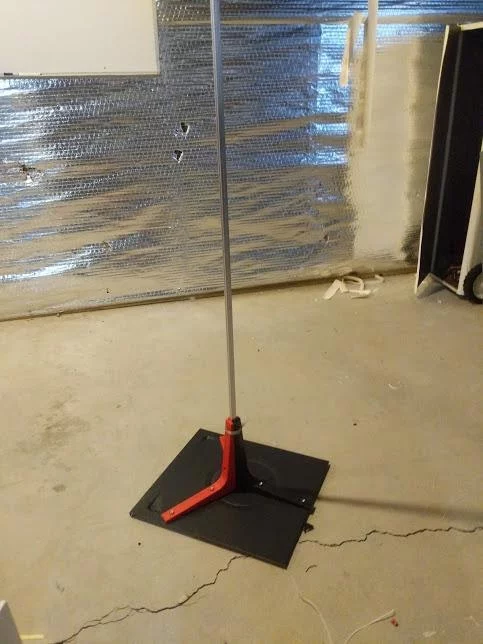
For the first installation of our final sensor version, we used a 1.5 m aluminum extrusion that was driven about 50 cm into the ground. Finding a location in the riverbed that was soft enough to drive in the extrusion but firm enough to support the sensor was difficult, but we settled on a location under a bridge. Unfortunately, when we came to check on this sensor after a few days, we found the pole had been bent significantly from what we imagine were large ice sheets being carried down by the water. Additionally, a large amount of debris collected on the sensor pole which obstructed our ToF distance sensor.
The next deployment of our third iteration drove the development of new mounting systems. We located an alternative spot to mount the sensor, somewhat downstream from our first location, in shallower and faster-moving water. The streambed here was much rockier than our original location, making it nearly impossible to get the metal pole deep enough to provide the necessary stability. To solve this issue, a system was developed in which the aluminum extrusion was fastened to a steel plate through the use of L-brackets. This was placed onto the streambed, and covered with rocks for stability. This new system gave us much greater versatility in the selection of deployment locations. The faster-moving and shallower water made it much more difficult for debris to build up after the sensor, and after a few days there was essentially no debris built up on the sensor at all. Additionally, by moving to a location in the stream somewhat away from the bridge, the strength of the sensor’s cellular connection was also improved.
First sensor data · 2020/4/13
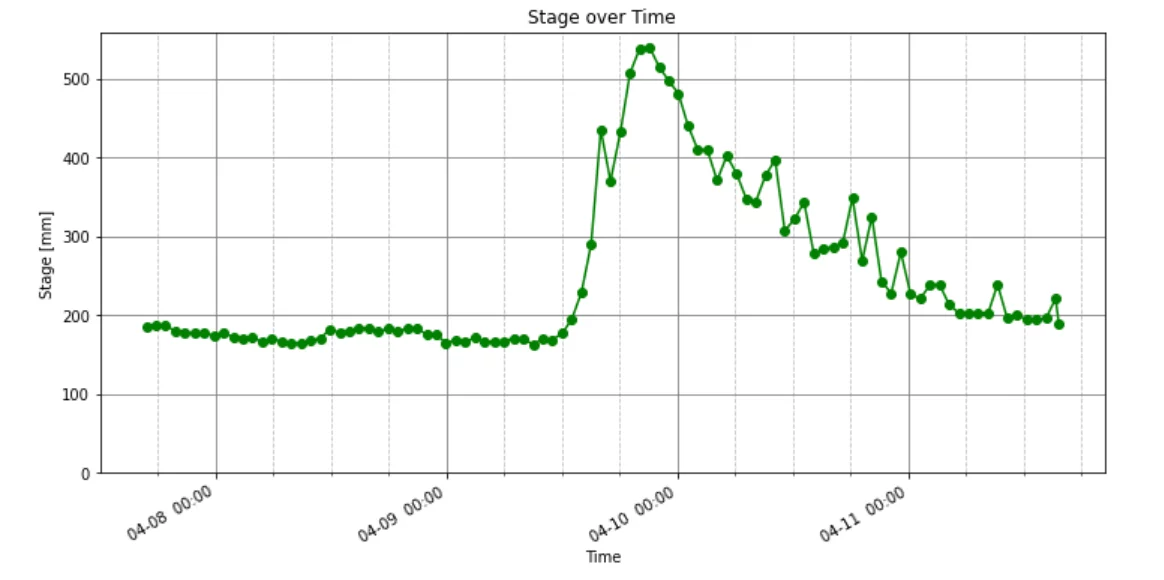
A clear surge and recovery of stream water levels from rain fall
After deploying our latest sensor version to a small local river, we were able to collect some usable stage data during a pretty big rainstorm.
Within about an hour of the rainstorm starting, the stage began to climb at a pretty staggering rate. During its rise, we were concerned that our sensor would become submerged at some point, but the water level eventually peaked about 25 cm from the bottom of our sensor. Needless to say, we would mount the sensor a bit higher next time around.
We noticed that while our sensor data was very consistent before the rain, it became erratic on its way down. After inspecting the sensor, this again turned out to be debris buildup on the sensing pole. We have begun looking into ways to mitigate this buildup or prevent it from affecting our readings.
OTA updates · 2020/4/24
The frequent trips to the stream for software updates were starting to get tiring, so we sought to implement OTA updates. We also wanted to be able to change the frequency at which our sensor wakes up and takes a measurement (e.g. hourly, every 15 minutes).
The Particle Electron microcontroller we are using supports OTA updates out of the box, but it does not save flash requests in any kind of queue. This means that we can’t update the device firmware for the time that the sensor is in a deep sleep. Additionally, even if we could time the update exactly for when it wakes, the runtime has been minimized to about 15 seconds and so it would not have enough time to complete the update before going back into a deep sleep.
We created a server that handles both the OTA and variable frequency features of the sensor. When the device wakes, it accesses a json file on our server. This contains two pieces of information, the amount time that the device should deep sleep for and whether or not there is an OTA update available.
If there is a piece of firmware ready to upload, the device publishes “ready_for_update” to Particle and waits for 2 minutes. Using webhooks, our OTA server sees this message from the device. It uses Particle JS API to flash the device with the firmware in its queue.
While this seems pretty convoluted, this solution allows the device to skip the 2 minute waiting time if there is no update available which saves battery life. We hope to use the variable measurement frequency to take readings more often when we detect some anomaly with stream conditions.
Sensor underwater · 2020/4/28
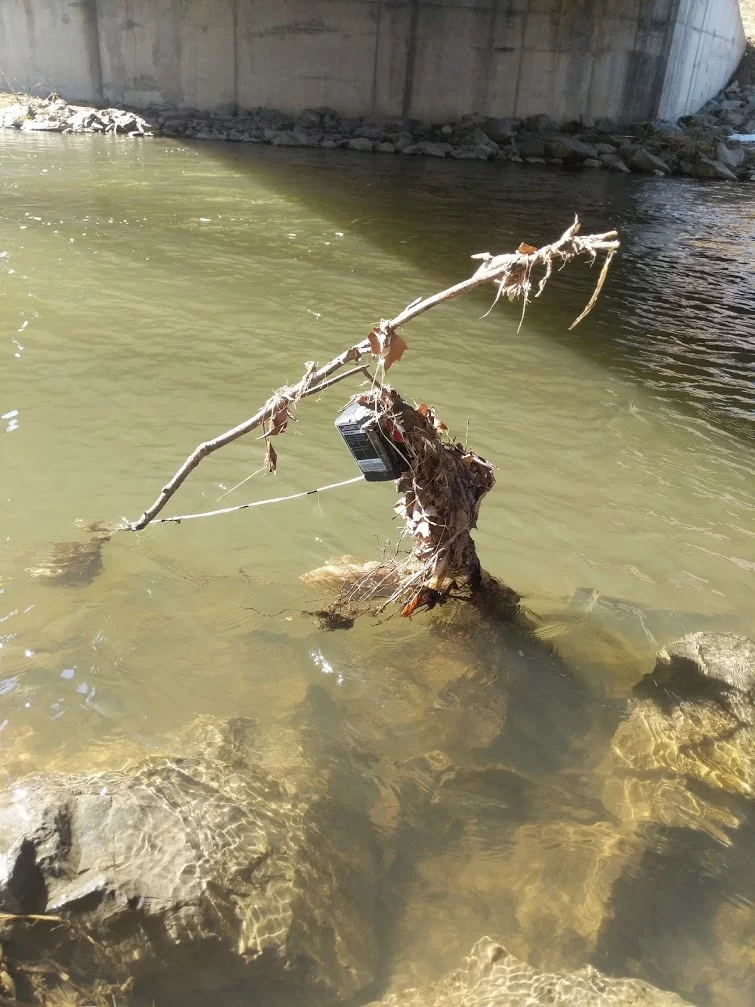
Our sensor mysteriously stopped reporting measurements back to us yesterday around 3 am. The battery and cellular strength all seemed to be acceptable, so we were unsure what had happened to it. The last few readings from the sensor show the stream water level rising rapidly, but nothing that we hadn’t seen before in previous rain storms. When we visited the sensor that evening here’s what we saw.
Yeah, we didn’t see the sensor either. After getting into the river, we found our whole sensor and mounting plate had tipped over and our sensor was entirely submerged under the water. We did not have very high hopes for the sensor, as it had probably been under the water for a good 18 hours by then. But, miraculously, the sensor woke up as usual as soon as we pressed its reset button.
When I later took it apart to inspect the damage, I found that the insides were very moist, but there was no puddle of water or major damage to the internals. We determined that the mounting solution was what needed fixing rather than the device it self.
When we first started the project, our initial idea for mounting was to hammer in a hexagonal aluminum extrusion into the river bed and mount the sensor directly to the top of it. When we came to Alplaus, we found that the rocky bed would not allow us to get the extrusion deep enough to be held securely.
Our next solution was a frankenstein of L brackets and an old desktop side cover. This would use rocks to weigh down the metal plate and hold the extrusion upright.
You may be able to see why this design didn’t end up working. As soon as the water level and velocity rises, the metal plate acts like a sail and sends our sensor straight into the water. We need some more stability against tipping. So, continuing with the frankenstien theme, our current plan is to combine the two ideas.
First, we’ll start by using a steel rod and a hammer to create a hole in the river bed. Then the aluminium extrusion will be placed in that hole. And finally, the metal plate will be attached to the pole and have rocks to weight it down to add some stability.
Measuring stream velocity · 2020/5/11
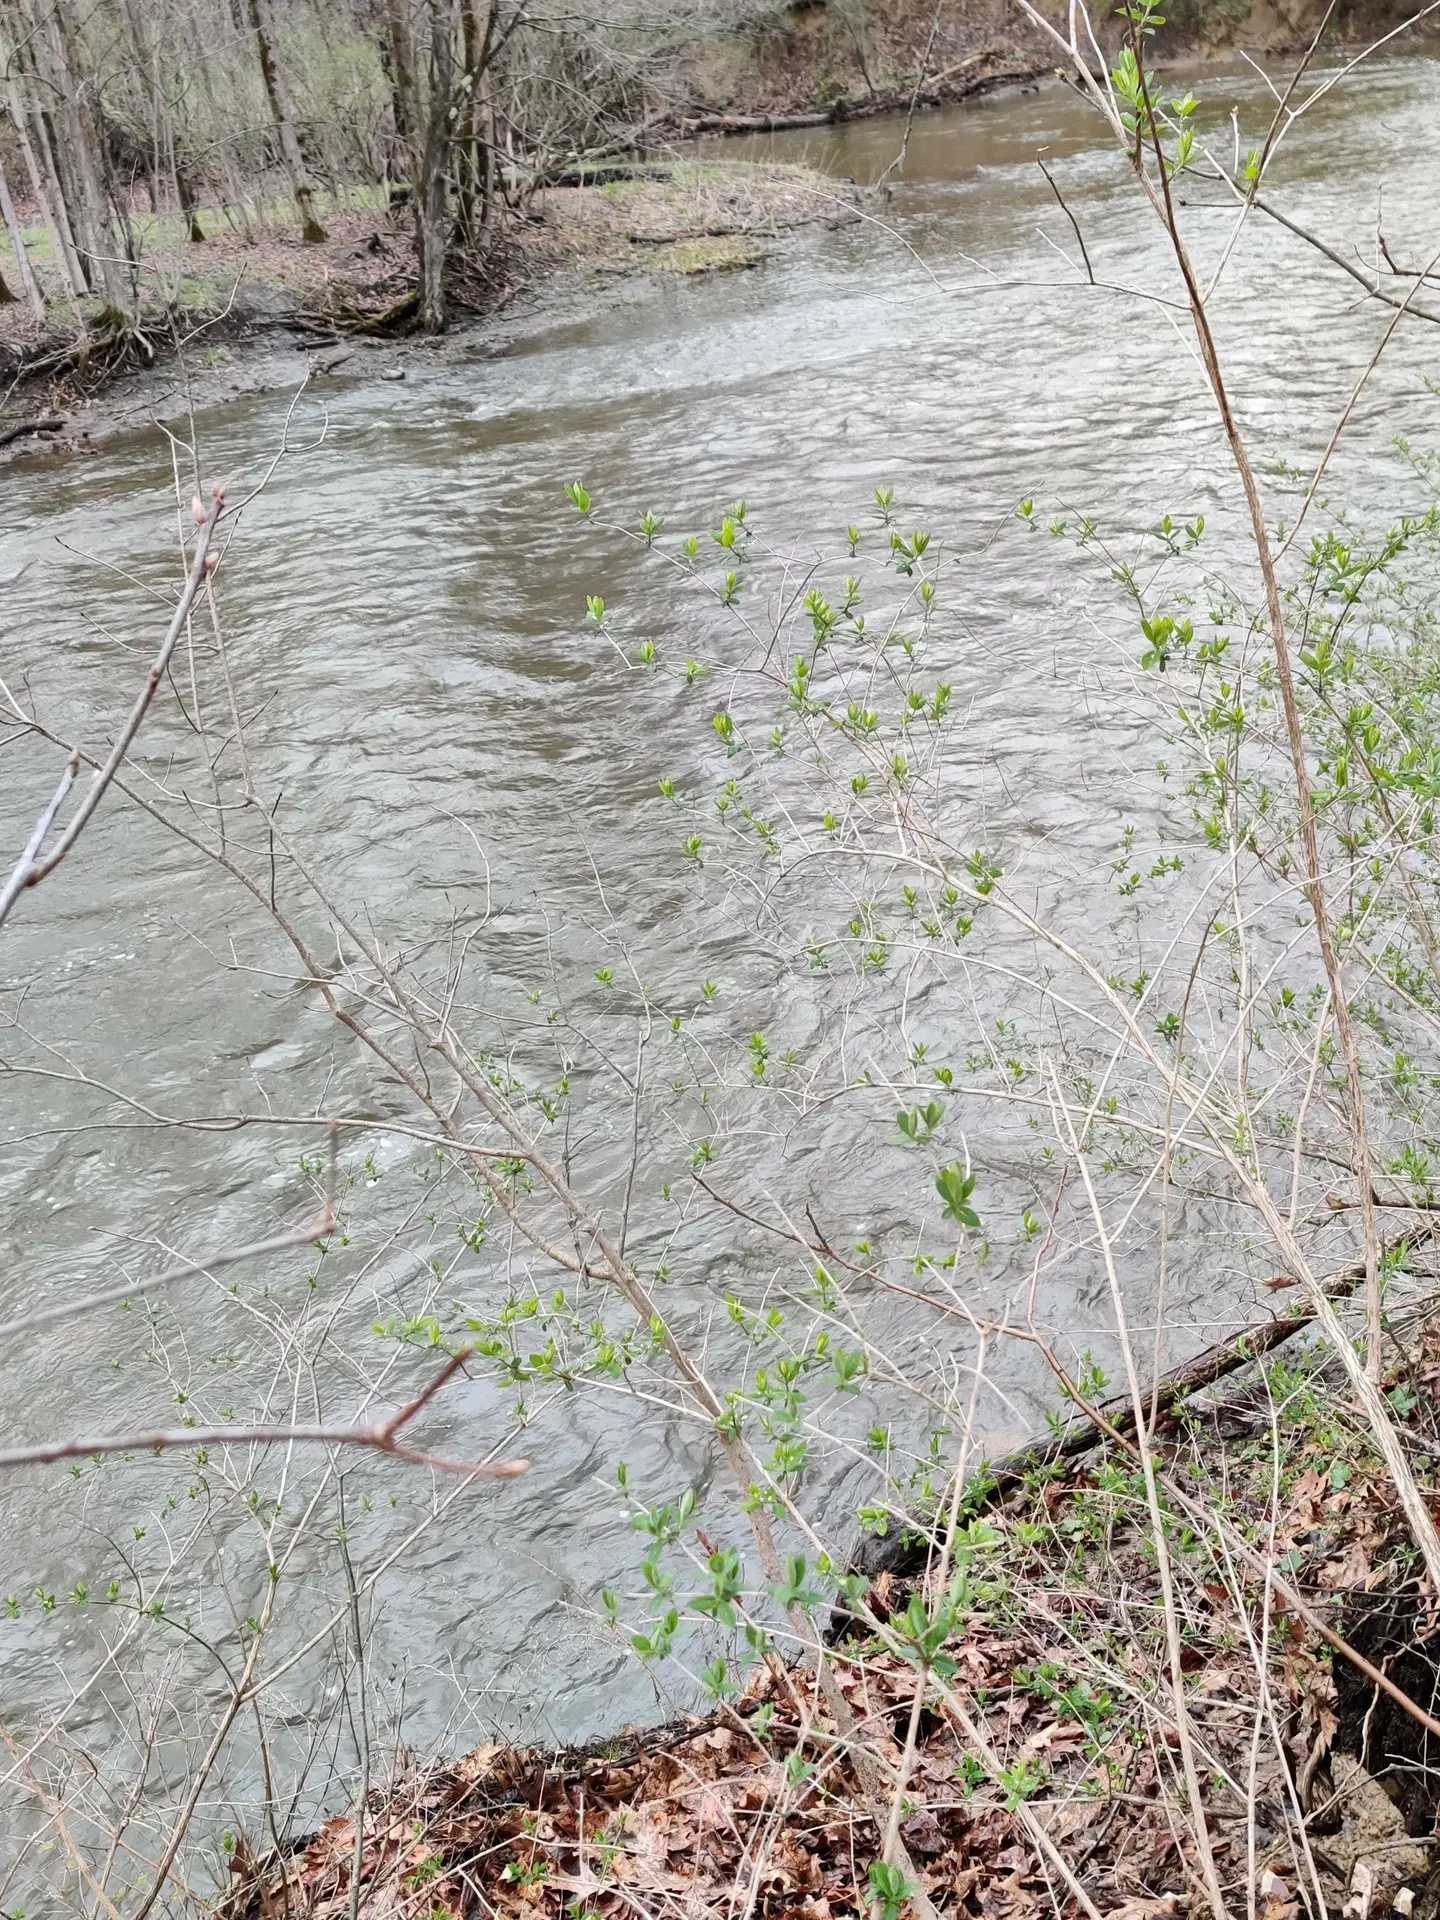
While stage height can provide useful data to help predict flood events or other localized events, it is sometimes not enough to be able to quantitatively measure how one water body will interact with another.
The flow rate can provide this data, but in order to measure it, you need to know a) the cross section of the stream, b) the height of the water flowing through that cross section, and c) the velocity of the water. Our device directly measures the height of the water and we did a project log on getting the cross section of a stream. We thinking about two different approaches.
1. Infer It
This is where the installer of the device would measure the average velocity manually when the stream is at a variety of different water levels to correlate the two. In theory, there’s only one water velocity for a given water level. The installer could come to the stream a number of times (e.g. when the stage is 5 cm, 20 cm, 50 cm and 1 meter) and measure the velocity with a propeller based current meter. At that point, a unique expression that correlates velocity and stage could be created for the stream.
2. Measure it on device
Measuring the velocity in real time reduces the number of times an installer has to visit the device location, and it may provide new insight that we wouldn’t gather from the first option. The most obvious way to do it is with a propeller based current meter. However, if we’ve learned anything from this project, it’s that debris will find its way into anything open to it. Shrouding it in some sort of case is an option, but in general we would like to keep the device free of moving parts.
We’re also thinking about finding the velocity indirectly. By measuring the drag force that an object feels in the water, we should be able to calculate the velocity. We imagine a small load cell mounted near the base of the sensor with a plate mounted to its other end. This study appears to be doing a very similar thing in a lake.
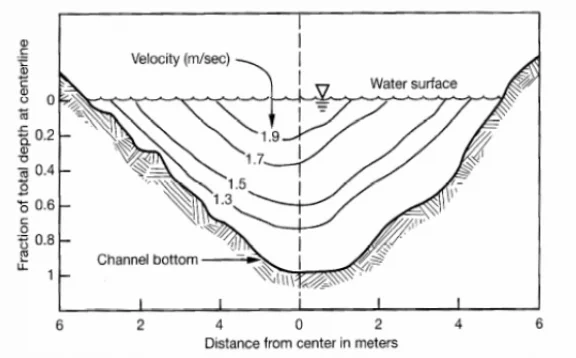
There is actually a phenomenon that isn’t fully addressed by any of these methods. The velocity of water in a stream varies from near 0 at the stream bed to its maximum on the surface. The cross section looks something like this.
Measuring velocity like this in real time is probably out of the question for our sensor’s budget. Maybe if this kind of measurement was taken once, we could use the height to infer the velocity. However, even one manual analysis like this is costly and labor intensive.
Neither of us are environmental science experts (or engineering experts for that matter), so we would love any feedback that you might have.
New sensor deployed · 2020/10/3
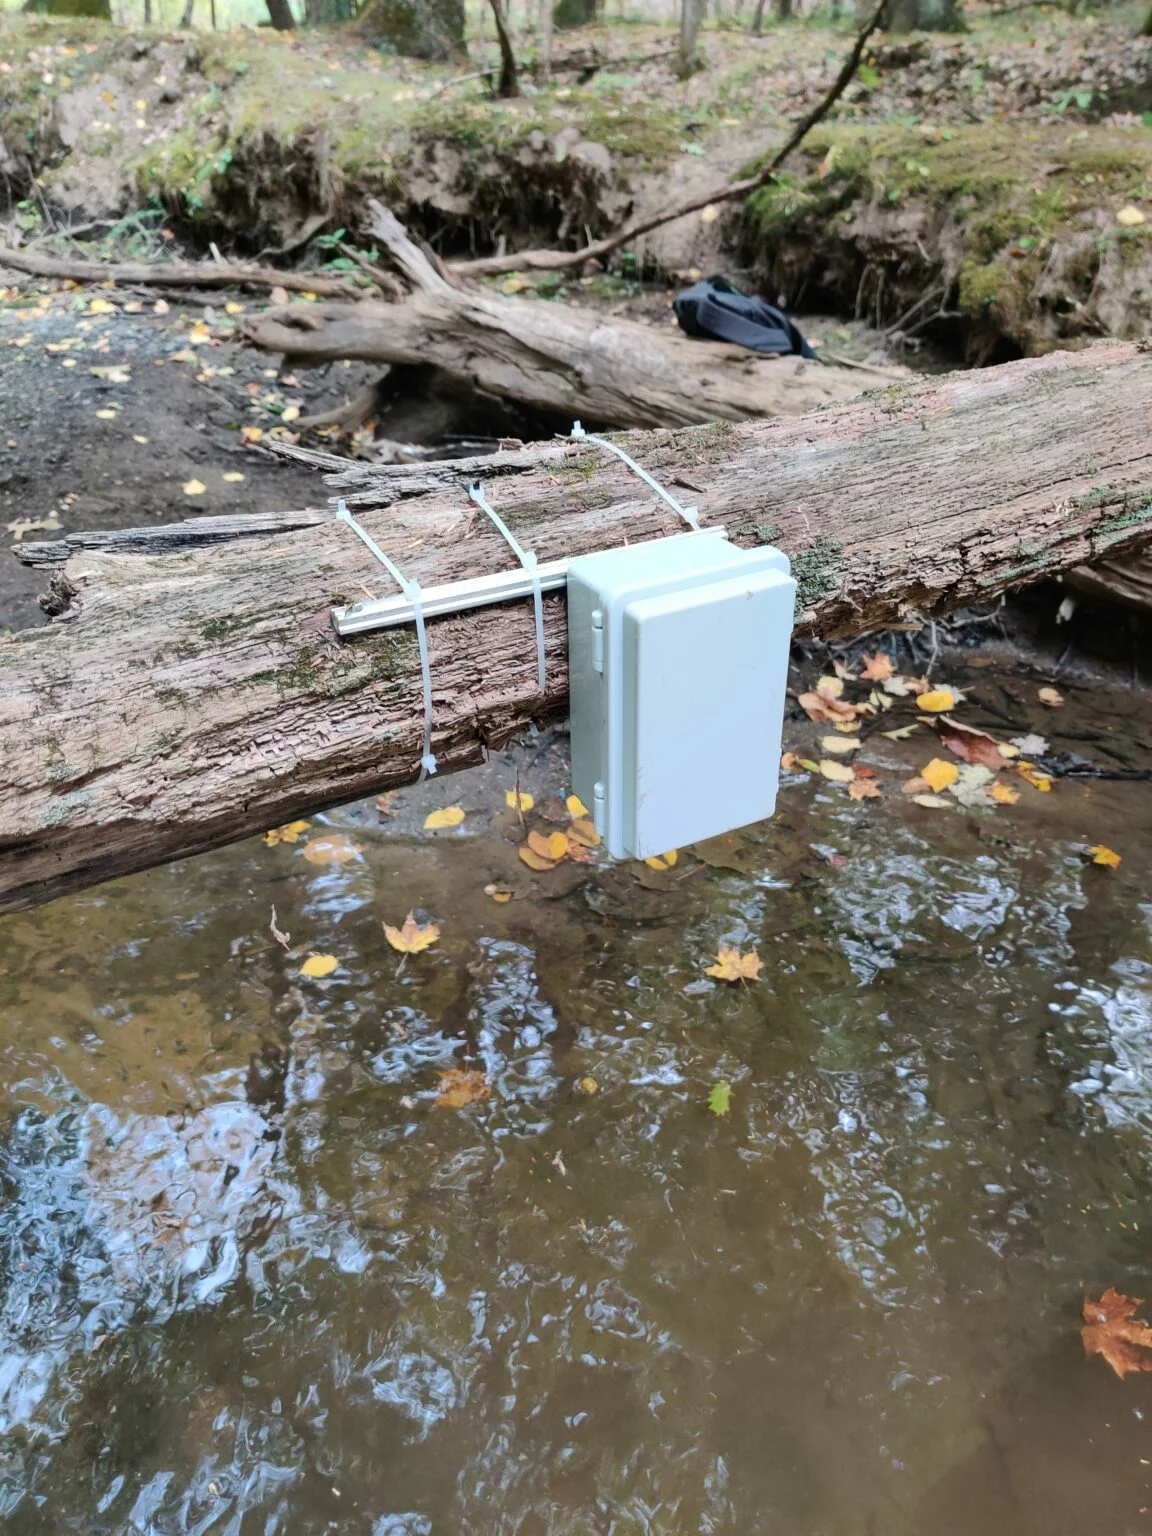
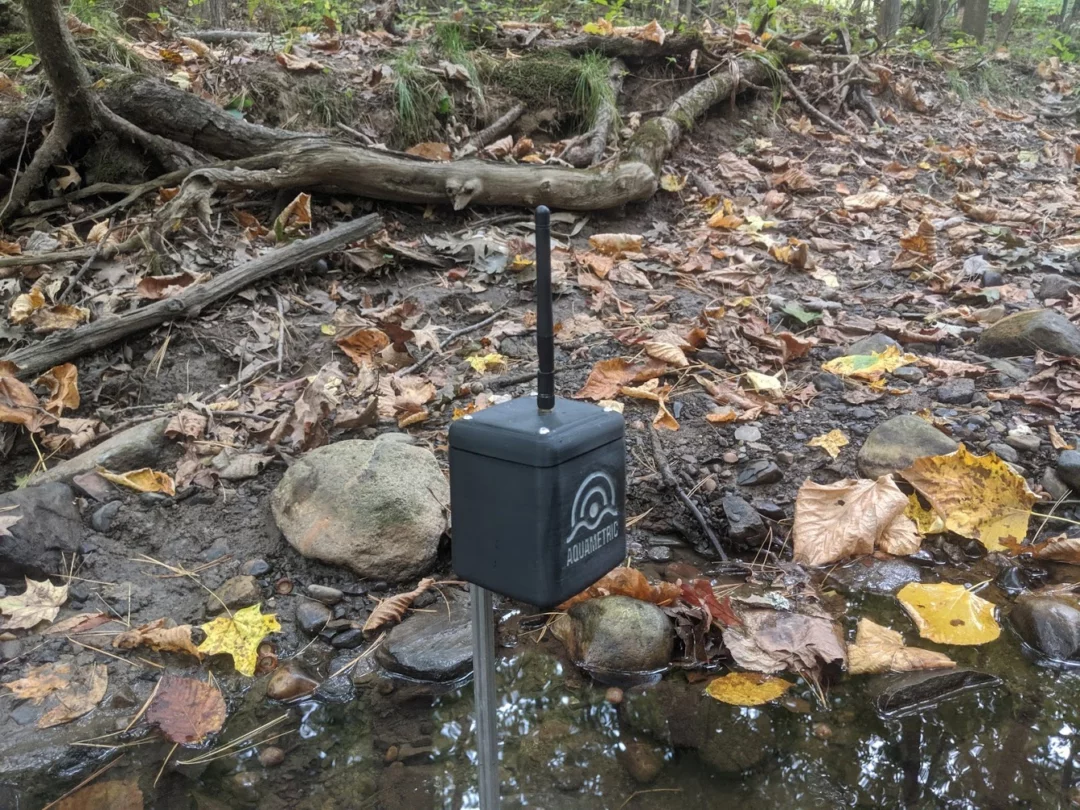
Version 2.0 mounted in Lisha Kill
We have been working on designing and releasing our next sensor version. This one focuses on using more readily available parts and being more versatile depending on the situation in which it is deployed.
To read more about this sensor’s design and some rough steps to create your own, visit our new guide at guide.aquametric.live. Keep in mind this is still very much a work in progress, so some of the pages may not be complete.
We were planning to install our sensor via a single aluminum rod hammered into the stream bed. When we reached the stream, we realized that this plan was not going to work. The stream bed was extremely rocky. No amount of hammering was going to mount the rod securely enough.
We settled on mounting the sensor to a tree overhanging the stream. Zip ties were used to secure the main device and auxiliary sensor cables to the log. While it may look crude, the sensor is very securely mounted, probably better than many of our other solutions.
In fact the tree mounting has a slight advantage over our other options. Since, there is no mounting parts that enter the water, there is very little for debris to collect around, so we expect to get more stable stage readings from it.
It has only been installed for a week now, but we have already seen some promising data. This shows the stream recovering to normal levels over a few days after a heavy rain.